
The Worlds of Journalism Study Global Index on Journalists’ Safety draws on two sets of information. The first one is based on a survey of 30,890 journalists in 73 countries conducted in the period 2021-2024 as part of the third wave of the Worlds of Journalism Study. In addition, the index incorporates information on journalists’ killings from UNESCO’s Observatory of Killings for the period 2016-2024. The index includes four dimensions of safety – physical (50%), psychological (25%), digital (12.5%) and financial (12.5%) in line with the Worlds of Journalism Study’s definition of safety developed by Slavcheva-Petkova et al. (2023). According to this understanding, journalists’ safety is defined as “the extent to which journalists can perform their work-related tasks without facing threats to their physical, psychological, digital, and financial integrity and well-being.” The index is a joint initiative between the Worlds of Journalism Study and the University of Liverpool. See Methodology for detailed information.
In general, the index shows that journalist safety is strongly related to the general political environment and rule of law in a country. National safety, politics, stability, and respect for human rights and freedom of expression are of key importance. Countries such as Yemen, Pakistan and El Salvador have the lowest safety index scores, while the European democracies with an established human rights and freedom of expression record, such as Portugal, Norway and Germany, have the highest ranking. The countries with the lowest scores are the ones in which journalists have been killed in relation to their work.
The regional ranking shows that the countries in the Middle East and North Africa have the lowest average overall safety score, followed by Latin America and the Caribbean, Asia, Africa, and Central and Eastern Europe (Table 1). The countries in Western Europe, North America, Australia and New Zealand score highest on overall safety. Even within a single region, trends can differ depending on the general political and economic environment and respect for human rights and freedom of expression. We see the least amount of variation in overall safety scores in Western Europe, North America, Australia and New Zealand.
The regional ranking for the physical and psychological dimensions is exactly the same as for overall safety again with the least amount of variation for Western Europe, North America, Australia and Australia, but more variation within all other regions, particularly the Middle East and North Africa and Asia for the physical dimension and not much variation for the psychological dimension within those regions. The ranking looks slightly different for the digital dimension, where Latin America scores better than in the other three dimensions, while Africa’s and Asia’s rankings are lower. While there is some manoeuvre within the dimensions for these three regions, the general trend is very clear: the countries in Western Europe, North America, Australia, and New Zealand are the safest for journalists across all dimensions, followed by Central and Eastern Europe. The lowest ranks are consistently occupied by the Middle East and North African countries. In general, if a country is safe in one dimension, it is likely also safe in others. Overall, the lowest average score is for financial safety, followed by the psychological, physical and digital safeties in that order. The gender gap within each country tends to be smaller than the overall safety gap between different countries.
Regional Rankings (no. 1 = safest region) | Regional Scores | |||
Mean | Number of countries | Standard deviation | ||
Overall safety | 1. Western Europe, North America, Australia and New Zealand | 83.58 | 20 | 3.71 |
2. Central and Eastern Europe | 80.35 | 17 | 5.89 | |
3. Africa | 76.51 | 6 | 7.30 | |
4. Asia | 73.33 | 13 | 11.09 | |
5. Latin America and the Caribbean | 69.79 | 13 | 8.02 | |
6. Middle East and North Africa | 63.34 | 4 | 12.29 | |
Physical safety | 1. Western Europe, North America, Australia and New Zealand | 90.14 | 20 | 4.39 |
2. Central and Eastern Europe | 85.79 | 17 | 9.55 | |
3. Africa | 83.41 | 6 | 9.32 | |
4. Asia | 77.49 | 13 | 16.8 | |
5. Latin America and the Caribbean | 71.84 | 13 | 13.94 | |
6. Middle East and North Africa | 61.76 | 4 | 18.52 | |
Psychological safety | 1. Western Europe, North America, Australia and New Zealand | 74.78 | 20 | 5.09 |
2. Central and Eastern Europe | 74.77 | 17 | 4.45 | |
3. Africa | 70.57 | 6 | 8.41 | |
4. Asia | 70.06 | 13 | 5.83 | |
5. Latin America and the Caribbean | 68.55 | 13 | 4.79 | |
6. Middle East and North Africa | 66.37 | 4 | 7.84 | |
Digital safety | 1. Western Europe, North America, Australia and New Zealand | 89.72 | 20 | 3.63 |
2. Central and Eastern Europe | 86.21 | 17 | 6.36 | |
3. Latin America and the Caribbean | 80.33 | 13 | 6.72 | |
4. Asia | 78.39 | 13 | 7.28 | |
5. Africa | 77.94 | 6 | 7.79 | |
6. Middle East and North Africa | 73.68 | 4 | 13.97 | |
Financial safety | 1. Western Europe, North America, Australia and New Zealand | 69.83 | 20 | 7.35 |
2. Central and Eastern Europe | 65.34 | 17 | 5.2 | |
3. Africa | 60.22 | 13 | 10.51 | |
4. Asia | 58.32 | 6 | 11.81 | |
5. Latin America and the Caribbean | 55.95 | 6 | 6.11 | |
6. Middle East and North Africa | 54.51 | 4 | 11.16 | |
Table 1. Regional rankings
Physical Safety
The physical safety dimension includes actions and occurrences that lead to/may lead to bodily harm or that restrict physical mobility. These actions/occurrences include murder, beating, torture, sexual assault, and other work-related attacks that more directly cause harm to the body. They also include forced relocation, arrest, detention, imprisonment, abduction and disappearance, which could cause bodily harm but which also restrict physical freedom of movement, with unresolved consequences in cases such as disappearance, if it is permanent. Additionally, physical safety also relates to acute biological and weather/conflict-related events such as epi/pandemics, hurricanes, and war, which may cause injury or lead to ill-health. While we have an expansive definition of physical safety, our questionnaire was somewhat limited. In our study, the physical safety dimension, which formed 50% of the overall safety scale, given the tangible nature and gravity of killings and other physical attacks, was measured with these inclusions: external data on killings from the UNESCO Observatory of Killings (35% weight within the dimension), concern about physical safety (20%), and three physical safety experiences of journalists (15% each).
Journalists are physically the safest in Portugal, as compared with the 73 countries in our study, with a score close to 100 (=highest safety). Pakistan is the least safe, with a safety score just below 40, immediately preceded by Yemen. The countries falling within the lowest 20 ranks are from the Global South or Eastern Europe, but this pattern is interrupted by Israel, which also ranks really low. The safety scores decline more precipitously starting with the 54th rank (Chile). A regional analysis (Table 1) indicates a physical safety mean score spread of more than 25 points between the Global North regions (87.5 points; safest) and the Middle East and North Africa (61.76 points; least safe) for journalists. The largest dip in scores is between Latin America and the Caribbean (72.29) and Middle East and North Africa. Differences by gender are discussed below for all four safety dimensions and overall safety.
Psychological Safety
The psychological dimension weighs 25% of the overall safety scale and encompasses forms of non-physical harm. Rather than causing physical injury, these attacks aim to impair the psychological and emotional well-being of journalists. Such attacks can also serve as precursors to physical violence, acting as a threat before it is carried out. Often, these forms of psychological violence are used to silence journalists, whether through self-censorship so that topics are no longer addressed, or to destroy journalists' professional motivation, with the aim of driving them out of journalism. We consider both verbal aggression and intimidation of individual journalists and the creation and shaping of an environment in which journalism as a public service is questioned. Specific threats directed against journalists personally can include demeaning and hateful speech (16% weight within the dimension) or other threats and intimidation targeting them (16%), and can even extend to stalking (16%). In addition, there are attacks that, while directed against individuals, actually aim to delegitimize the profession as a whole, such as public discrediting (16%) of or even legal action against a journalist's work (16%). In addition, we incorporated journalists' general assessments of the atmosphere into the measurement of psychological safety, namely, the level of concern they express regarding their individual emotional and mental well-being (20% weight).
Geographically, the top 10 safest countries in this dimension are surprisingly scattered. Tanzania performs best (85.44 points), followed by two countries in the Global North (Germany: 83.65 points, Norway: 83.63 points), and then countries from Central, Eastern, and South-Eastern Europe (Kosovo: 81.48, Slovakia: 80.67 points, North Macedonia: 80.05 points). The country with the worst values is Yemen (55.29 points), a country with an extremely unstable political situation. Overall, on the aggregate level, the countries of the Global North (in Western Europe) are the safest, followed by countries in Central and Eastern Europe. Asia and Latin America are trailing at a distance.
Digital Safety
The digital safety dimension includes actions that impact journalists’ digital self-determination and freedoms. These are actions that threaten journalists’ digital privacy, including phishing attacks and digital surveillance, limit access to information, sources, and audiences, hack or block digital contents, criminalize digital whistle-blowing. Our questionnaire’s measures for the digital dimension, which formed 12.5% of the overall safety scale, used frequency of occurrence of two aspects (each weighted 50% within the digital dimension). These aspects were surveillance and hacking or blocking of social media accounts or websites.
Portugal ranks highest (98.12) for this dimension too, followed for the next 13 positions by European countries/ USA. Yemen, with an index score of just above the midpoint of 50, ranks the lowest and is preceded for the next 13 ranks by non-European countries. This pattern of Global North countries being top scorers in digital safety and Global South countries having smaller digital safety is limited to the extremities. In between, Taiwan ranks 15th, Tanzania 26th, and Slovenia is less safe than Cuba. Most Eastern European countries occupy the lower middle ranks.The most precipitous decline in digital safety is between the last two ranks from Pakistan to Yemen. The regional analysis (Table 1) indicates a digital safety mean score spread of roughly 16 points between the Global North regions (89.72 points; safest) and the Middle East and North Africa (73.68 points; least safe).
Financial Safety
The financial dimension accounts for 12.5% of the overall safety scale. Since the financial crisis in the 2000s, trends toward precariousness in journalism have been increasingly publicly discussed worldwide. Due to digitalization and the new players it brought (e.g., large tech companies), commercial media lost their monopoly on the advertising market. The pandemic and the standstill in public life have exacerbated these developments. As a result, labour markets have shrunk in many countries, but this does not mean that there is less content produced. On the contrary: an ever-shrinking group of journalists is generating more and more of it. Accordingly, not only is job security a challenge for journalists, but also the condensation of working hours, which leads to overtime.
Five different indicators are included in this dimension. The first indicator is the extent of concern among journalists about losing their jobs within the next year (20% weight within this dimension). The second indicator is the current employment status (20%). Here, we distinguish between and weigh five different forms of employment relationships that, in our view, have greater or lesser potential to trigger precariousness. We consider permanent full-time employment to be ideal in terms of job security (score: 100). Since permanent part-time employment offers less income, this form of employment offers less security; therefore, we assigned it only half the weight of full-time employment (score: 50). We place temporary full-time employment between these two categories (score: 75), since it generally covers one's living expenses, at least for a certain period of time. We consider temporary part-time positions (score: 25) and freelance work (score: 25) to be the most insecure forms of employment. Certainly, with sufficient prominence, one can even earn more as a freelancer than in a permanent full-time position. However, the risk of becoming ill and falling through the social safety net is far greater than for permanently employed journalists. These ratings are certainly debatable, but were the result of a long consideration process. The third indicator is the income that journalists reported earning through journalism. Here, too, we distinguish between different levels of security. If journalists generate 100% from journalism, they do not need any additional income and are therefore financially safe (score: 100). For all other proportions, we assigned lesser scores: A score of 75 for (less than) 75% of their income from journalism, a score of 50 for (less than) 50%, and a score of 25 for (less than) 25%. Journalists who reported generating less than 25% of their income from journalism received the lowest score (0). The fourth indicator is an (albeit rough) indicator of work time intensification and stress. Many countries have a commitment to the 40-hour workweek, which corresponds to full-time employment. We see the ideal case for job security as being achieved with full employment and (less than) 40 working hours (score: 100). However, the more hours journalists have to work, the worse the score becomes: 75 for (less than) 50 hours, 50 for (less than) 60 hours, 25 for (less than) 70 hours and 0 for more than 70 hours. We also take the income indicator into account when calculating the score: if journalism makes up 100% of someone's overall work-related income, and this journalist works 35 hours/week, they would get a score of 100. However, if they work the same hours but only for 50% of their overall work-related income, they would get a score of 25, because their workload would equal 70 hours per week for a full-time employee. Finally, the fifth indicator is the respondents' income. In the Worlds of Journalism study, we surveyed income in ten categories, as absolute income figures are not comparable across countries. The two lowest income categories (1 and 2) offer the least financial security and therefore receive a score of 0. Categories 3 and 4 are assigned a value of 25. The middle categories (5 and 6) correspond to the mean value of 50. Categories 7 to 8 are assigned a value of 75, and the top earners (categories 9-10) enjoy the greatest financial security (value: 100).
Norway leads the list (79.09 points). Tanzania achieved the highest scores in the psychological safety dimension but ranks towards the bottom of the financial ranking (45.74 points). Yemen, which ranked last in the psychological safety ranking, is just ahead (46.41 points). The three countries with the worst financial safety ranking are Ecuador, Egypt and Pakistan. In regional clusters, the countries of Western Europe, North America, Australia, and New Zealand are the most financially secure. These are followed by the countries of Central and Eastern Europe, Asia and Africa. Latin America and the Caribbean, along with the even more insecure MENA region are at the rear.
Gender Differences
The WJS survey includes data from journalists who do not identify as either male or female (0.4%). At this stage, in our analysis, we include only male and female respondents. Analysis by all genders will be conducted at a later stage. Overall, by country, the gender difference in the safety index between men and women is small and sometimes barely different. However, as will be seen in the more detailed breakdowns, there are important gendered differences. Chart 1, by focusing on the gender gap and its size in each country, provides a detailed picture of safety differences by gender. A negative number in the charts denotes that women journalists are less safe in a country than their male colleagues.
Chart 1: Overall Safety Index Scores Ranked by Gender Gap
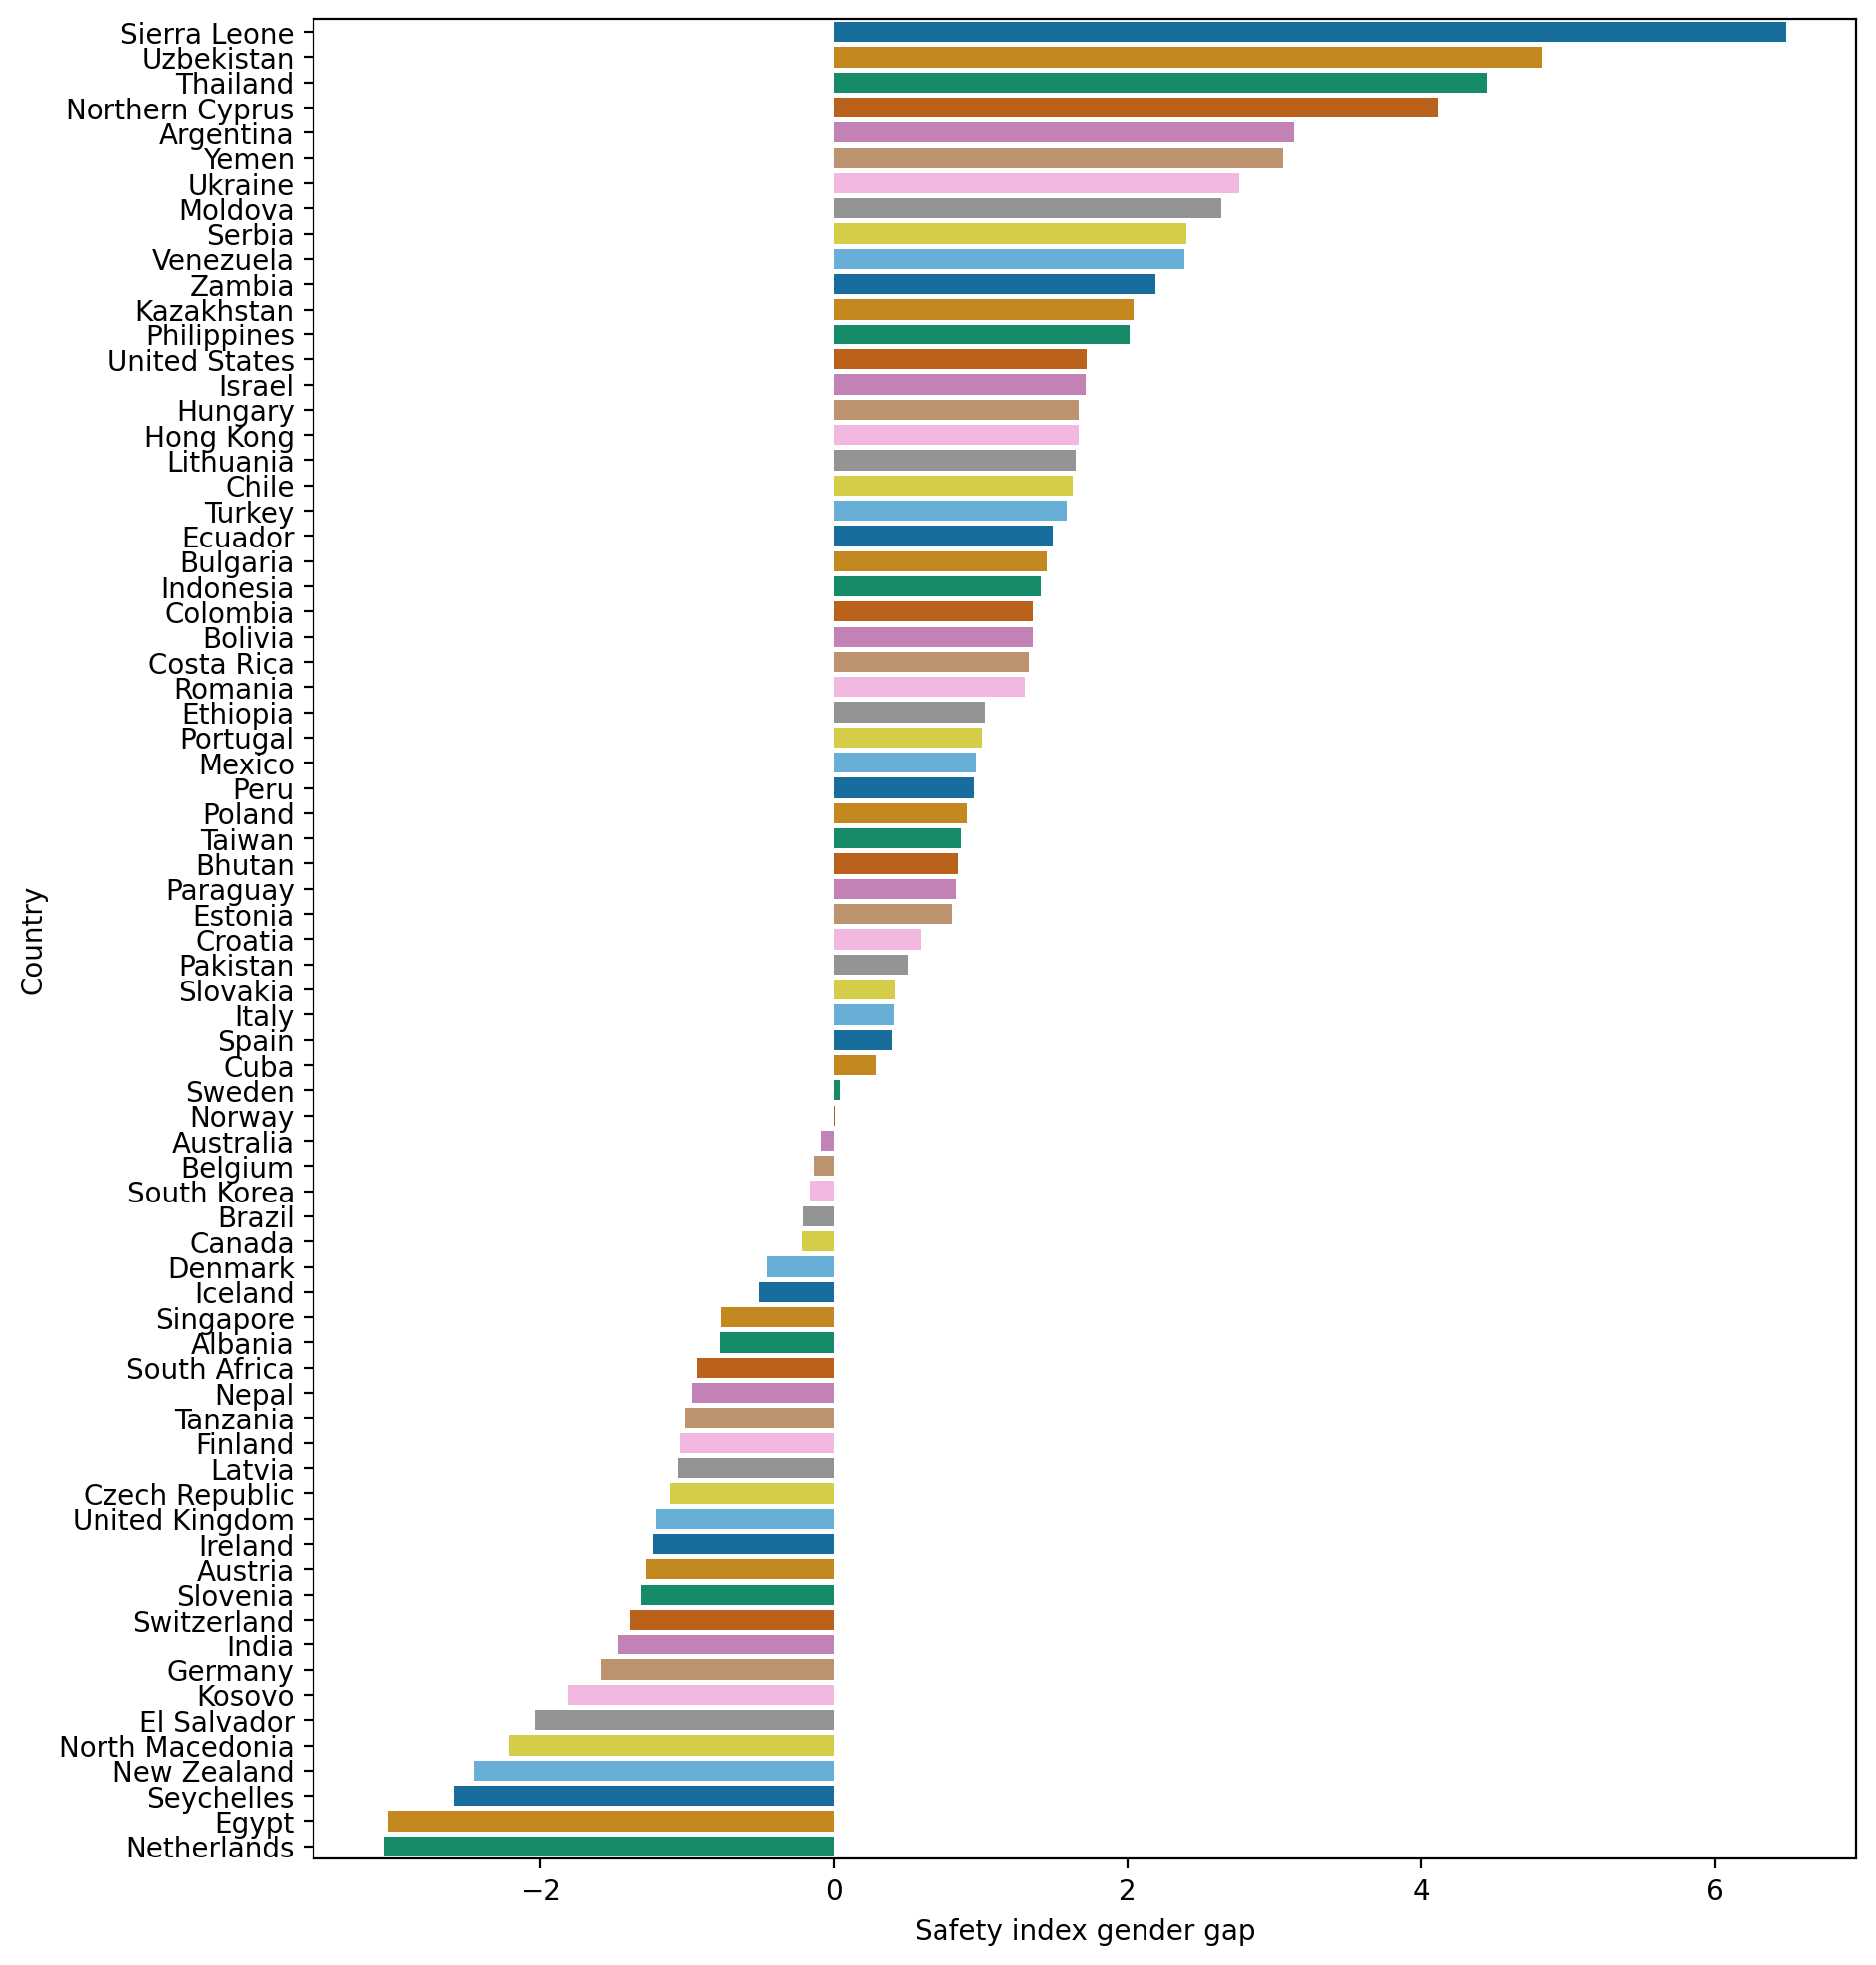 In terms of overall safety, there are slightly more countries in which men are less safe than women journalists. However, when we explore the results by dimension, it becomes clear that there are important gender differences. In the physical dimension, which contributes 50% to the overall score, women journalists are generally less safe worldwide than male journalists.
Chart 2: Physical Safety Dimension Scores Ranked by Gender Gap
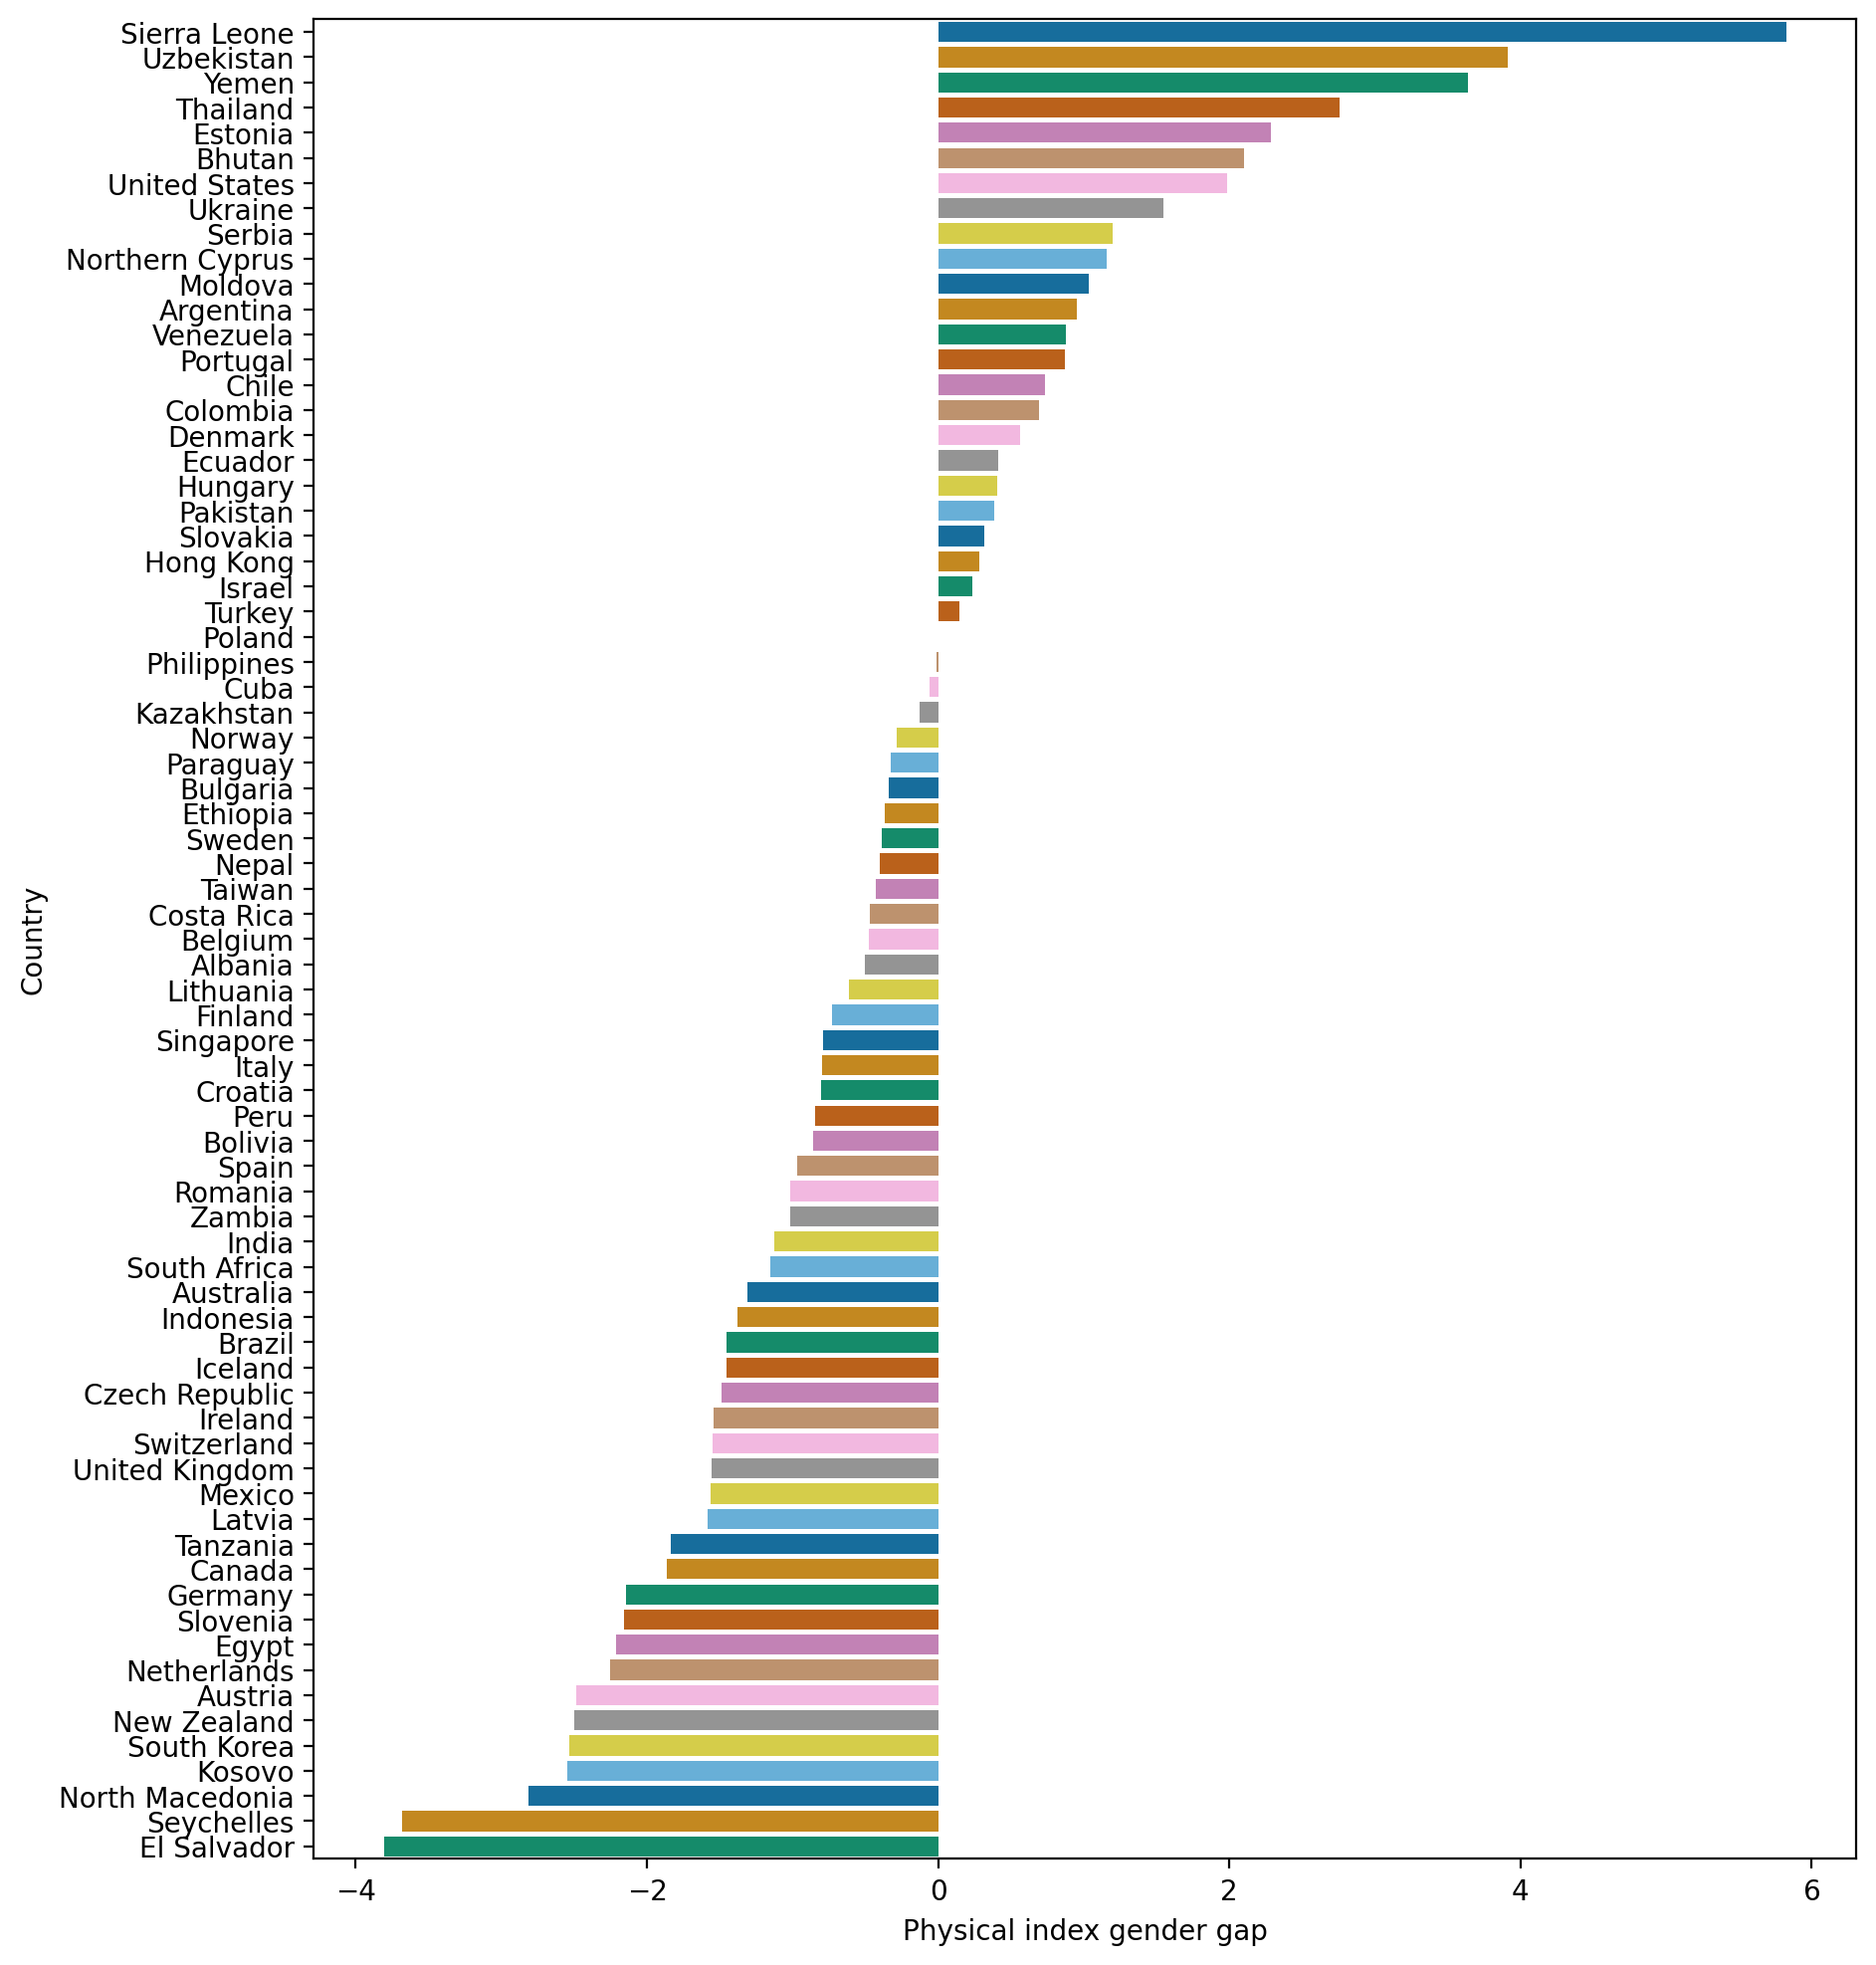 As chart 2 shows, there are more countries where women are less safe physically than their male colleagues.One key reason for this is that the biggest difference between men and women is that women journalists experience sexual assault and harassment much more frequently than their male colleagues. 19.5% of women journalists reported they had experienced sexual assault or sexual harrassment in the last five years compared to 8.6% of male journalists. This is over twice as many and the difference is statistically significant.
Chart 3: Psychological Safety Dimension Scores Ranked by Gender Gap
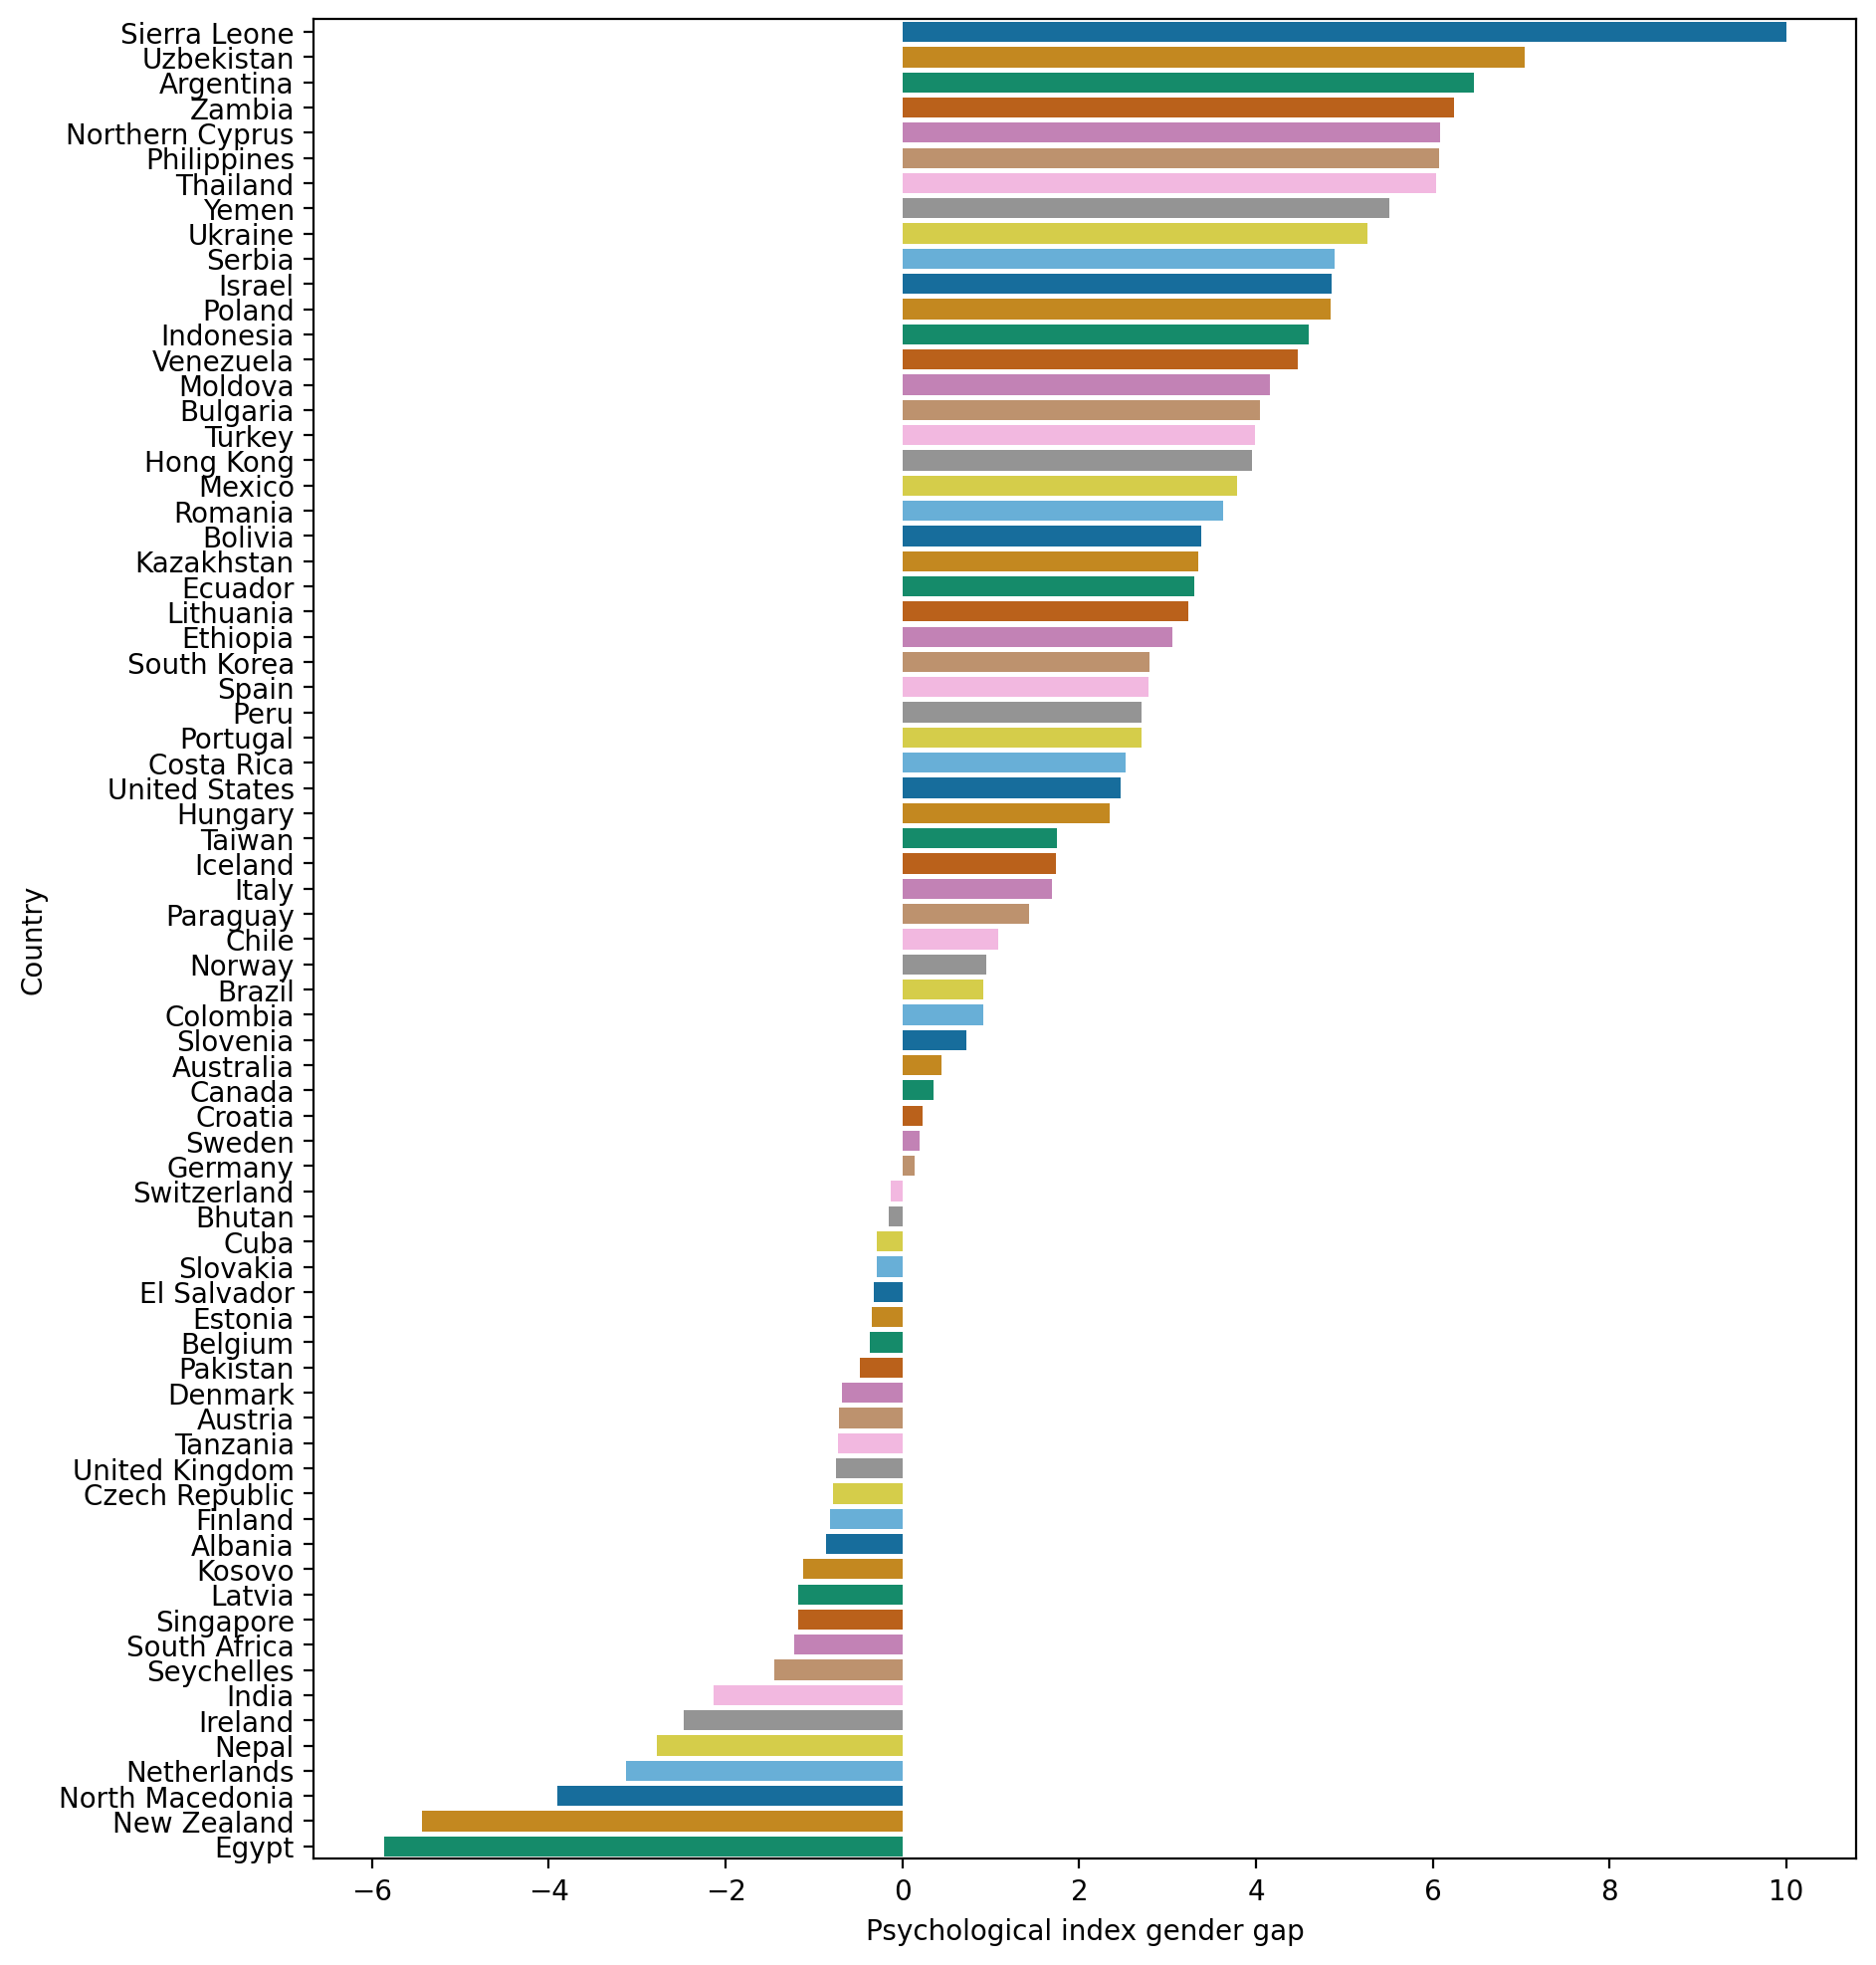 As chart 3 shows, in relation to the psychological dimension, there are more countries where men are generally less safe than women journalists. This can be explained by the fact that more men than women report having experienced the five types of threats included in this dimension: demeaning or hateful speech, public discrediting of their work, legal actions against them because of their work, stalking and other threats or intimidation directed at them. However, more women than men reported they were concerned about their emotional and mental wellbeing. In all cases, the differences were statistically significant.
Chart 4: Digital Safety Dimension Scores Ranked by Gender Gap
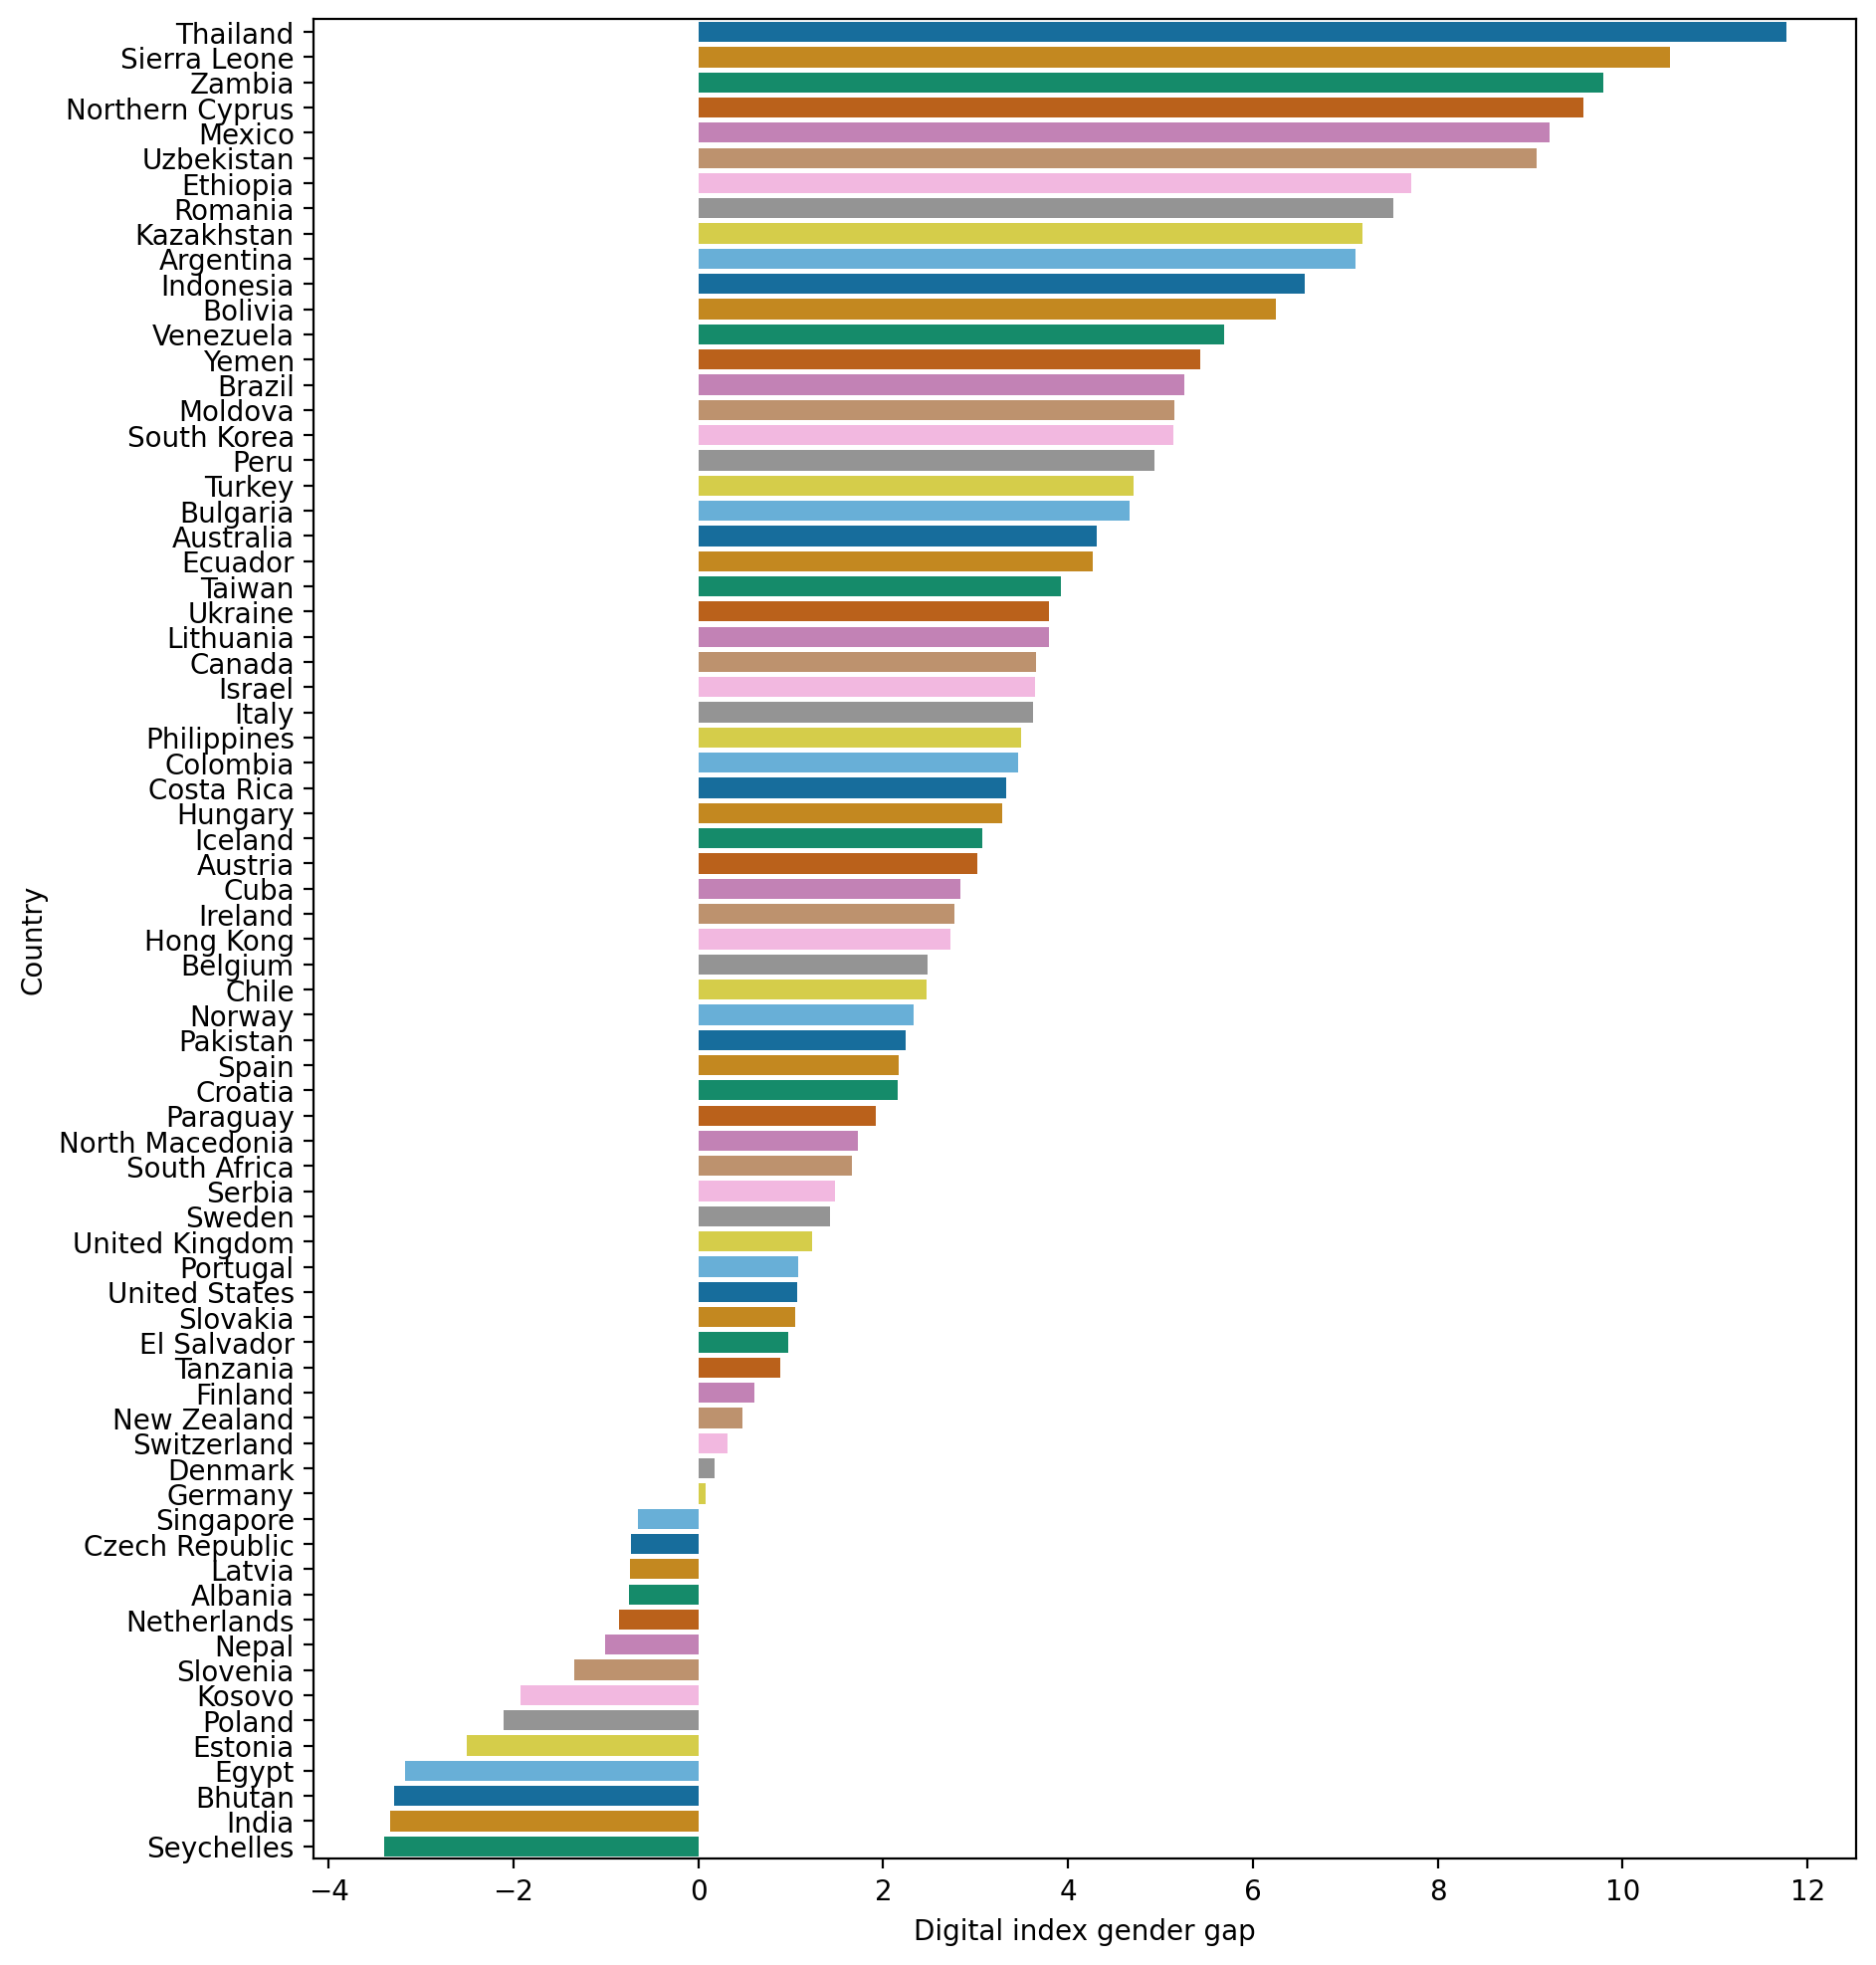 Chart 4 then shows that in terms of digital safety in a far larger number of countries men are more likely to report experiences of digital threats than women. This is the dimension with the largest gender gaps.
Chart 5: Financial Safety Dimension Scores Ranked by Gender Gap
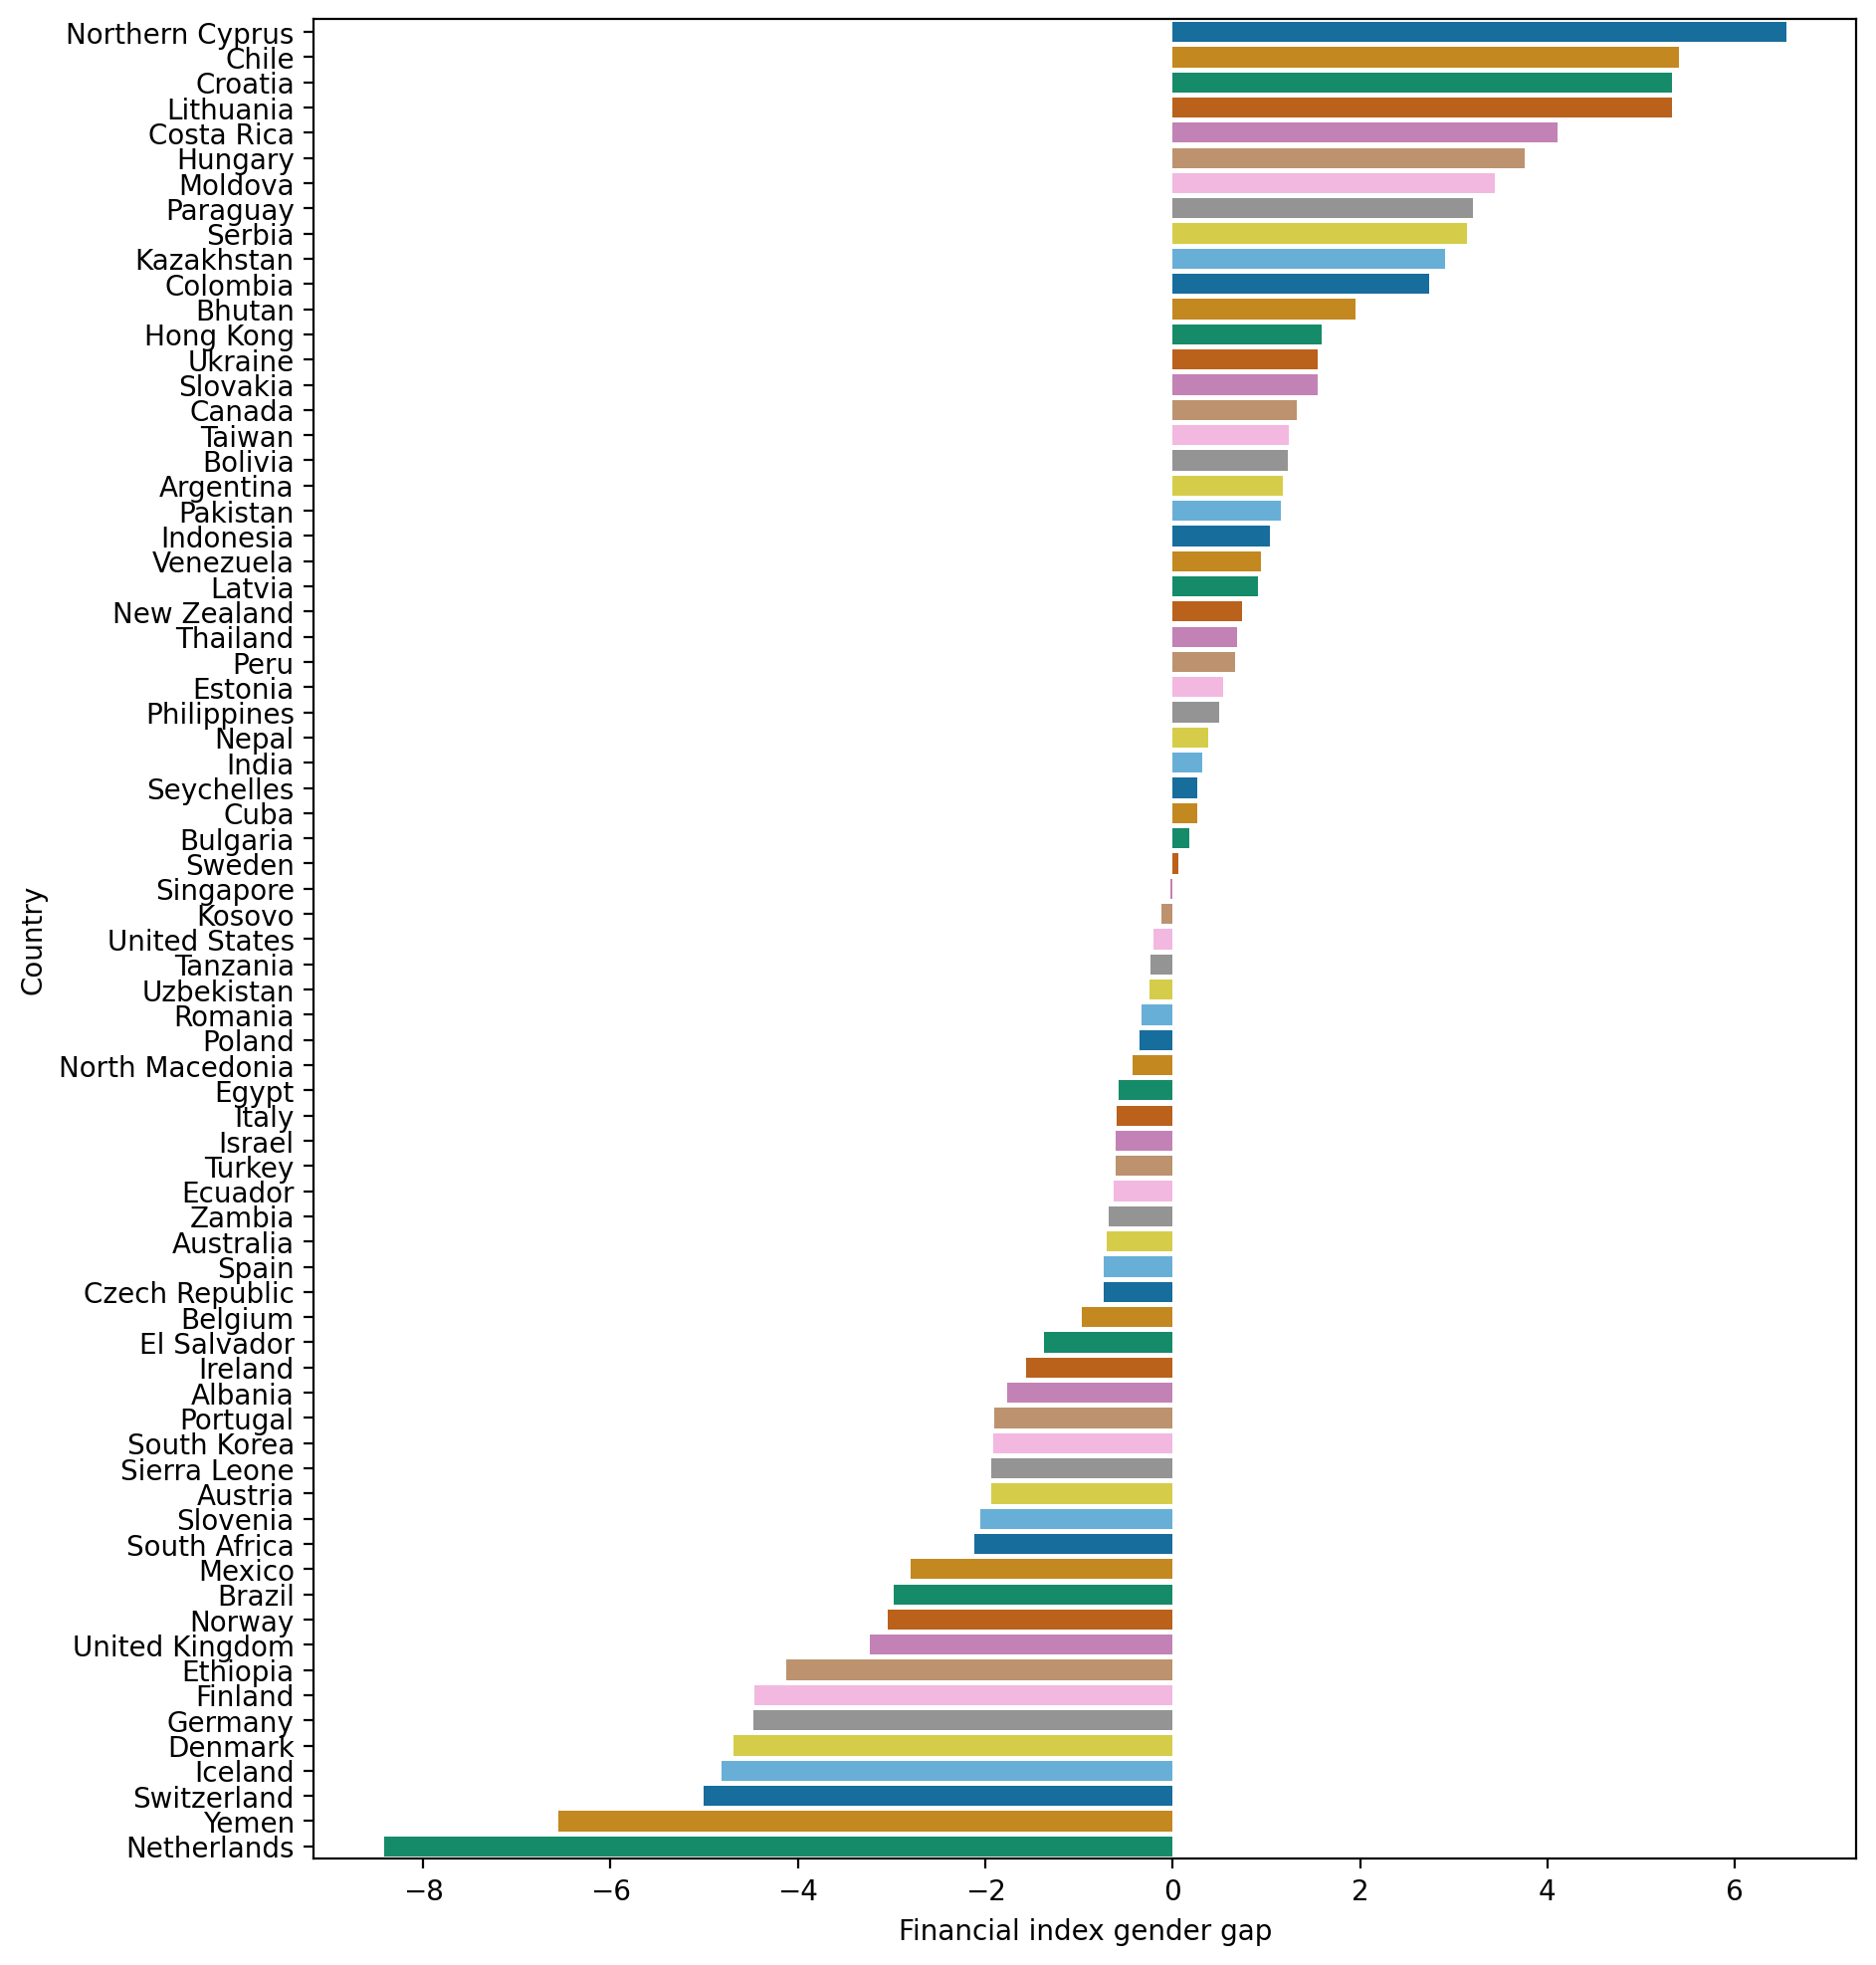 Chart 5 shows that financial safety is an issue that appears to affect male and female journalists almost equally. The chart is balanced, with almost an equal number of countries on either side of the zero score. The country with the highest gender gap on this dimension, the Netherlands, is particularly financially unsafe for women journalists.
Overall, in conclusion, physical and to an extent financial safety appear to be the dimensions where women journalists fare worse than their male colleagues. The biggest difference between men and women is that considerably more women journalists experience sexual assault and harassment than their male colleagues. The psychological and digital dimensions appear to affect male journalists more but women are more concerned about their emotional and mental well-being than men. Though not included in the index because the question was not asked in all countries, another statistically significant difference is that more women journalists have experienced workplace bullying in the last five years compared to men (almost 30% and 25%, respectively).
References
Slavtcheva-Petkova, V., Ramaprasad, J., Springer, N., Hughes, S., Hanitzsch, T., Hamada, B., Abit, Hoxha, & Steindl, N. (2023). Conceptualizing Journalists’ Safety around the Globe. Digital Journalism, 11(7), 1211–1229. https://doi.org/10.1080/21670811.2022.2162429